
Indicator Gauge Icon Legend
Legend Colors
Red is bad, green is good, blue is not statistically different/neutral.
Compared to Distribution
 the value is in the best half of communities.
 the value is in the 2nd worst quarter of communities.
 the value is in the worst quarter of communities.
Compared to Target
 meets target;
  does not meet target.
Compared to a Single Value
 lower than the comparison value;
 higher than the comparison value;
 not statistically different from comparison value.
Trend

 non-significant change over time;
 significant change over time;
  no change over time.
Compared to Prior Value
 higher than the previous measurement period;
 lower than the previous measurement period;
 no statistically different change from previous measurement period.
 Significantly better than the overall value
 Significantly worse than the overall value
 No significant difference with the overall value
 No data on significance available
Nonfatal Overdoses per Month
Measurement Period: September 2018
This indicator is archived and is no longer being updated. Click to learn more
This indicator shows the number of nonfatal opioid overdoses occurring monthly within the St. Louis area (City & County). Nonfatal overdoses are an opioid overdose where the individual survived, commonly because of the use of naloxone. Nonfatal overdoses are those reported by health systems, EMS agencies, or community members (where healthcare or EMS were not involved).
Why is this important?
Persons experiencing a nonfatal overdose have an increased risk of a fatal overdose. The number of nonfatal overdoses, in combination of with fatal overdoses, will provide a more complete understanding of the opioid epidemic in the community and can be used to evaluate resource capacity. Data from health systems, EMS agencies, and the MO-HOPE field report were combined to provide the most complete count of nonfatal overdoses occurring in the St. Louis area (City & County).
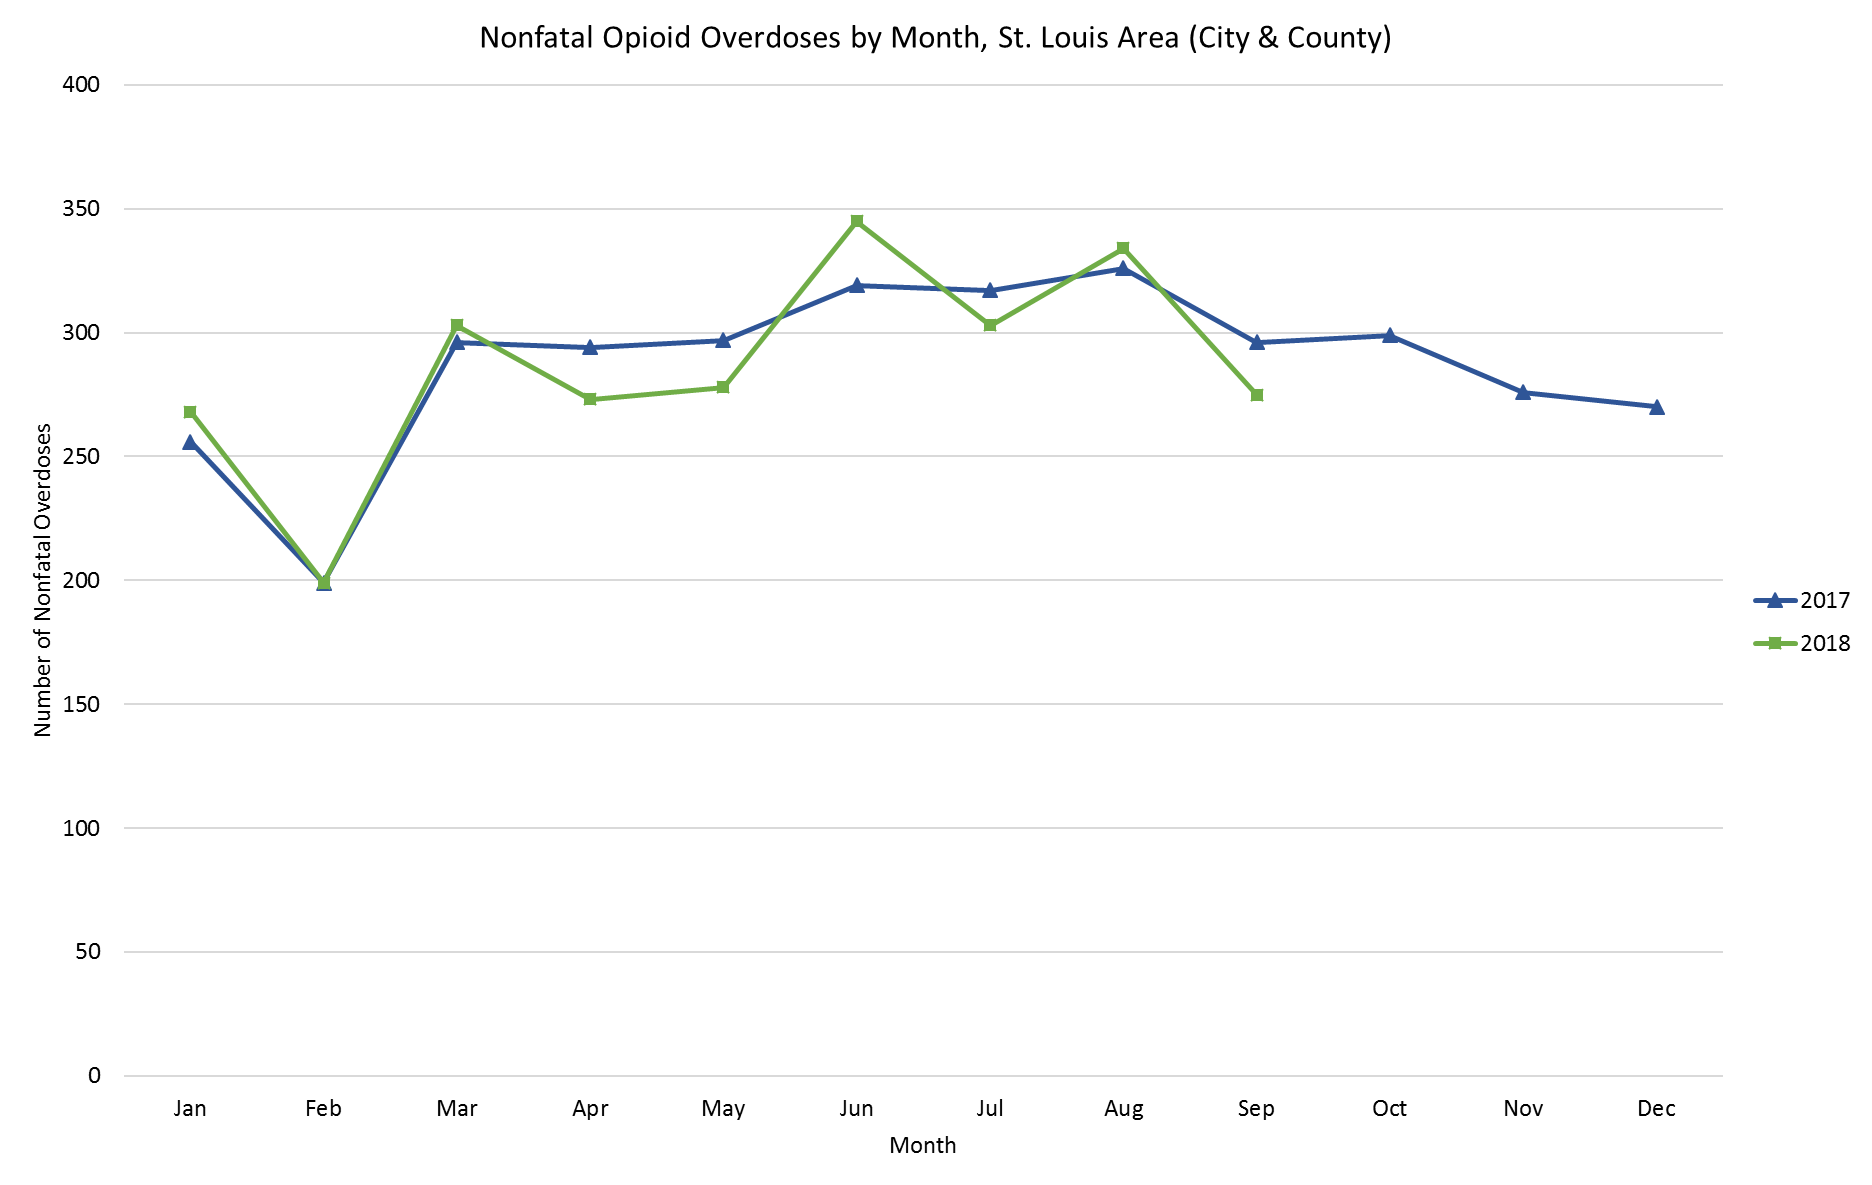
Note:This graph highlights the seasonal trends of which overdoses occurred between 2017-2018. This is important because it allows us to direct our resources and focus on prevention methods before the next seasonal peak .
Region: St. Louis Area (City + County)
275
nonfatal overdoses/ month
Source:
stlouisco: St. Louis County Opioid Action Plan
Measurement period: September 2018
Maintained by: Saint Louis County Department of Public Health
Last update: December 2018
Measurement period: September 2018
Maintained by: Saint Louis County Department of Public Health
Last update: December 2018
Compared to

Graph Selections

Data Source
- stlouisco: St. Louis County Opioid Action Plan
Maintained By: Saint Louis County Department of Public Health
Filed under: Health / Alcohol & Drug Use, Health / Medications & Prescriptions, Health, Infants, Children, Teens, Adults, Older Adults